Now Reading: Far-red chemigenetic kinase biosensors enable multiplexed and super-resolved imaging of signaling networks
-
01
Far-red chemigenetic kinase biosensors enable multiplexed and super-resolved imaging of signaling networks
Far-red chemigenetic kinase biosensors enable multiplexed and super-resolved imaging of signaling networks
Data availability
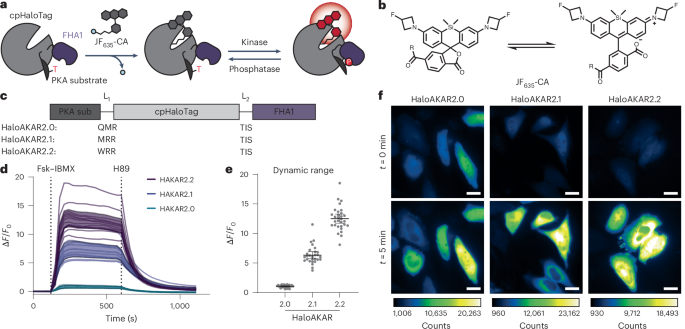
Plasmids encoding pcDNA3.1-HaloAKAR2.0-T2A-EGFP, pcDNA3.1-HaloAKAR2.1-T2A-EGFP, pcDNA3.1-HaloAKAR2.2-T2A-EGFP, pcDNA3.1-HaloAKAR2.1-NES-T2A-EGFP-CAAX, pcDNA3.1-HaloAKAR2.1-CLC, pcDNA3.1-HaloCKAR2.2-T2A-EGFP, pcDNA3.1-HaloAktKAR2.2-T2A-EGFP and pcDNA3.1-HaloEKAR2.2-T2A-EGFP are deposited on Addgene. The stable cell line generated is available upon request. Source data are provided with this paper. Further data supporting the findings of this study are available upon request.
Code availability
Custom MATLAB scripts (R2023a 9.14.0.2254940) for clathrin-coated pit analysis, custom ImageJ macros and R code used to analyze imaging data, as well as bash and R scripts used to analyze sequencing data, are available via GitHub at https://github.com/jinzhanglab-ucsd (ref. 30). Python code (Jupyter Notebook 6.5.4 with python 3.11.5) used to analyze lattice light-sheet data is available via GitHub at https://github.com/pylattice/livelattice (ref. 73) and https://github.com/schoeneberglab/Segmentation/blob/main/3D_spheroid_cell_segmentation.ipynb (ref. 74).
References
-
Gest, A. M. M. et al. Molecular spies in action: genetically encoded fluorescent biosensors light up cellular signals. Chem. Rev. 124, 12573–12660 (2024).
-
Yan, R., Wang, B. & Xu, K. Functional super-resolution microscopy of the cell. Curr. Opin. Chem. Biol. 51, 92–97 (2019).
-
Lu, K., Vu, C. Q., Matsuda, T. & Nagai, T. Fluorescent protein-based indicators for functional super-resolution imaging of biomolecular activities in living cells. Int. J. Mol. Sci. 20, 5784 (2019).
-
Mishra, K. et al. Genetically encoded photo-switchable molecular sensors for optoacoustic and super-resolution imaging. Nat. Biotechnol. 40, 598–605 (2022).
-
Mo, G. C. H. et al. Genetically encoded biosensors for visualizing live-cell biochemical activity at super-resolution. Nat. Methods 14, 427–434 (2017).
-
Anton, S. E. et al. Receptor-associated independent cAMP nanodomains mediate spatiotemporal specificity of GPCR signaling. Cell 185, 1130–1142 (2022).
-
Zhang, J.-F. et al. An ultrasensitive biosensor for high-resolution kinase activity imaging in awake mice. Nat. Chem. Biol. 17, 39–46 (2021).
-
Mehta, S. et al. Single-fluorophore biosensors for sensitive and multiplexed detection of signalling activities. Nat. Cell Biol. 20, 1215–1225 (2018).
-
Shcherbakova, D. M., Cox Cammer, N., Huisman, T. M., Verkhusha, V. V. & Hodgson, L. Direct multiplex imaging and optogenetics of Rho GTPases enabled by near-infrared FRET. Nat. Chem. Biol. 14, 591–600 (2018).
-
Oliinyk, O. S., Shemetov, A. A., Pletnev, S., Shcherbakova, D. M. & Verkhusha, V. V. Smallest near-infrared fluorescent protein evolved from cyanobacteriochrome as versatile tag for spectral multiplexing. Nat. Commun. 10, 279 (2019).
-
Cook, A., Walterspiel, F. & Deo, C. HaloTag-based reporters for fluorescence imaging and biosensing. ChemBioChem 24, e202300022 (2023).
-
Deo, C. et al. The HaloTag as a general scaffold for far-red tunable chemigenetic indicators. Nat. Chem. Biol. 17, 718–723 (2021).
-
Wang, L., Hiblot, J., Popp, C., Xue, L. & Johnsson, K. Environmentally sensitive color-shifting fluorophores for bioimaging. Angew. Chem. Int. Ed. 132, 22064–22068 (2020).
-
Lee, J. D. et al. Far-red and sensitive sensor for monitoring real time H2O2 dynamics with subcellular resolution and in multi-parametric imaging applications. Preprint at bioRxiv https://doi.org/10.1101/2024.02.06.579232 (2024).
-
Farrants, H. et al. A modular chemigenetic calcium indicator for multiplexed in vivo functional imaging. Nat. Methods 21, 1916–1925 (2024).
-
Depry, C., Allen, M. D. & Zhang, J. Visualization of PKA activity in plasma membrane microdomains. Mol. Biosyst. 7, 52–58 (2011).
-
Wang, L., Hiblot, J., Popp, C., Xue, L. & Johnsson, K. Environmentally sensitive color‐shifting fluorophores for bioimaging. Angew. Chem. 132, 22064–22068 (2020).
-
Grimm, J. B. et al. A general method to fine-tune fluorophores for live-cell and in vivo imaging. Nat. Methods 14, 987–994 (2017).
-
Liu, L. et al. Integration of FRET and sequencing to engineer kinase biosensors from mammalian cell libraries. Nat. Commun. 12, 5031 (2021).
-
Koberstein, J. N., Stewart, M. L., Mighell, T. L., Smith, C. B. & Cohen, M. S. A Sort-Seq approach to the development of single fluorescent protein biosensors. ACS Chem. Biol. 16, 1709–1720 (2021).
-
Chen, M., Sun, T., Zhong, Y., Zhou, X. & Zhang, J. A highly sensitive fluorescent Akt biosensor reveals lysosome-selective regulation of lipid second messengers and kinase activity. ACS Cent. Sci. 7, 2009–2020 (2021).
-
Keyes, J. et al. Signaling diversity enabled by Rap1-regulated plasma membrane ERK with distinct temporal dynamics. eLife 9, e57410 (2020).
-
Seino, S. & Shibasaki, T. PKA-dependent and PKA-independent pathways for cAMP-regulated exocytosis. Physiol. Rev. 85, 1303–1342 (2005).
-
Tenner, B. et al. Spatially compartmentalized phase regulation of a Ca2+-cAMP-PKA oscillatory circuit. eLife 9, e55013 (2020).
-
Ni, Q. et al. Signaling diversity of PKA achieved via a Ca2+-cAMP-PKA oscillatory circuit. Nat. Chem. Biol. 7, 34–40 (2011).
-
Bock, A. et al. Optical mapping of cAMP signaling at the nanometer scale. Cell 182, 1519–1530 (2020).
-
Tenner, B. et al. FluoSTEPs: fluorescent biosensors for monitoring compartmentalized signaling within endogenous microdomains. Sci. Adv. 7, eabe4091 (2021).
-
Wang, L., Frei, M. S., Salim, A. & Johnsson, K. Small-molecule fluorescent probes for live-cell super-resolution microscopy. J. Am. Chem. Soc. 141, 2770–2781 (2019).
-
Stockhammer, A. & Bottanelli, F. Appreciating the small things in life: STED microscopy in living cells. J. Phys. Appl. Phys. 54, 033001 (2020).
-
Lyons, A. C. & Frei, M. S. jinzhanglab-ucsd/HaloAKAR: ZenodoRelease. Zenodo https://doi.org/10.5281/zenodo.14962626 (2025).
-
Akerboom, J. et al. Genetically encoded calcium indicators for multi-color neural activity imaging and combination with optogenetics. Front. Mol. Neurosci. 6, 1–29 (2013).
-
Wang, L. et al. A high-performance genetically encoded fluorescent indicator for in vivo cAMP imaging. Nat. Commun. 13, 5363 (2022).
-
Harada, K. et al. Red fluorescent protein-based cAMP indicator applicable to optogenetics and in vivo imaging. Sci. Rep. 7, 7351 (2017).
-
Matsuda, S. et al. Generation of a cGMP indicator with an expanded dynamic range by optimization of amino acid linkers between a fluorescent protein and PDE5α. ACS Sens. 2, 46–51 (2017).
-
Zhao, Y. et al. An expanded palette of genetically encoded Ca2+ indicators. Science 333, 1888–1891 (2011).
-
Su, Q. et al. Sensitive fluorescent biosensor reveals differential subcellular regulation of PKC. Nat. Chem. Biol. 21, 501–511 (2025).
-
Wachter, S. B. & Gilbert, E. M. Beta-adrenergic receptors, from their discovery and characterization through their manipulation to beneficial clinical application. Cardiology 122, 104–112 (2012).
-
Hauser, A. S. et al. Common coupling map advances GPCR-G protein selectivity. eLife 11, e74107 (2022).
-
Inoue, A. et al. Illuminating G-protein-coupling selectivity of GPCRs. Cell 177, 1933–1947 (2019).
-
Avet, C. et al. Effector membrane translocation biosensors reveal G protein and βarrestin coupling profiles of 100 therapeutically relevant GPCRs. eLife 11, e74101 (2022).
-
Pizzoni, A., Zhang, X. & Altschuler, D. L. From membrane to nucleus: a three-wave hypothesis of cAMP signaling. J. Biol. Chem. 300, 105497 (2024).
-
Stallaert, W. et al. Purinergic receptor transactivation by the β2-adrenergic receptor increases intracellular Ca2+ in nonexcitable cells. Mol. Pharmacol. 91, 533–544 (2017).
-
Woodward, D. F., Jones, R. L. & Narumiya, S. International union of basic and clinical pharmacology. LXXXIII: classification of prostanoid receptors, updating 15 years of progress. Pharmacol. Rev. 63, 471–538 (2011).
-
Abramovitz, M. et al. The utilization of recombinant prostanoid receptors to determine the affinities and selectivities of prostaglandins and related analogs. Biochim. Biophys. Acta 1483, 285–293 (2000).
-
Lv, X. et al. Structures of human prostaglandin F2α receptor reveal the mechanism of ligand and G protein selectivity. Nat. Commun. 14, 8136 (2023).
-
Hébert, R. L. et al. Characterization of a rabbit kidney prostaglandin F2α receptor exhibiting Gi-restricted signaling that inhibits water absorption in the collecting duct. J. Biol. Chem. 280, 35028–35037 (2005).
-
Wright, S. C. et al. GLP-1R signaling neighborhoods associate with the susceptibility to adverse drug reactions of incretin mimetics. Nat. Commun. 14, 6243 (2023).
-
Müller, T. D. et al. Glucagon-like peptide 1 (GLP-1). Mol. Metab. 30, 72–130 (2019).
-
Gilon, P., Chae, H.-Y., Rutter, G. A. & Ravier, M. A. Calcium signaling in pancreatic β-cells in health and in type 2 diabetes. Cell Calcium 56, 340–361 (2014).
-
Brown, E., Heerspink, H. J. L., Cuthbertson, D. J. & Wilding, J. P. H. SGLT2 inhibitors and GLP-1 receptor agonists: established and emerging indications. Lancet 398, 262–276 (2021).
-
Andersen, A., Lund, A., Knop, F. K. & Vilsbøll, T. Glucagon-like peptide 1 in health and disease. Nat. Rev. Endocrinol. 14, 390–403 (2018).
-
Shemetov, A. A. et al. A near-infrared genetically encoded calcium indicator for in vivo imaging. Nat. Biotechnol. 39, 368–377 (2021).
-
Qian, Y. et al. A genetically encoded near-infrared fluorescent calcium ion indicator. Nat. Methods 16, 171–174 (2019).
-
Qian, Y. et al. Improved genetically encoded near-infrared fluorescent calcium ion indicators for in vivo imaging. PLoS Biol. 18, e3000965 (2020).
-
Pfeil, E. M. et al. Heterotrimeric G protein subunit Gαq is a master switch for Gβγ-mediated calcium mobilization by Gi-coupled GPCRs. Mol. Cell 80, 940–954 (2020).
-
Leysen, H. et al. GPCRs are optimal regulators of complex biological systems and orchestrate the interface between health and disease. Int. J. Mol. Sci. 22, 13387 (2021).
-
Marti-Solano, M. et al. Combinatorial expression of GPCR isoforms affects signalling and drug responses. Nature 587, 650–656 (2020).
-
Hauser, A. S., Attwood, M. M., Rask-Andersen, M., Schiöth, H. B. & Gloriam, D. E. Trends in GPCR drug discovery: new agents, targets and indications. Nat. Rev. Drug Discov. 16, 829–842 (2017).
-
Lambert, T. J. FPbase: a community-editable fluorescent protein database. Nat. Methods 16, 277–278 (2019).
-
Miyazaki, J.-I. et al. Establishment of a pancreatic β cell line that retains glucose-inducible insulin secretion: special reference to expression of glucose transporter isoforms. Endocrinology 127, 126–132 (1990).
-
Reissaus, C. A. et al. A versatile, portable intravital microscopy platform for studying beta-cell biology in vivo. Sci. Rep. 9, 8449 (2019).
-
Rueden, C. T. et al. ImageJ2: ImageJ for the next generation of scientific image data. BMC Bioinformatics 18, 529 (2017).
-
Schindelin, J. et al. Fiji: an open-source platform for biological-image analysis. Nat. Methods 9, 676–682 (2012).
-
Arganda-Carreras, I. et al. in Computer Vision Approaches to Medical Image Analysis (eds Beichel, R.R. & Sonka, M.) 85–95 (Springer, 2006).
-
Stringer, C., Wang, T., Michaelos, M. & Pachitariu, M. Cellpose: a generalist algorithm for cellular segmentation. Nat. Methods 18, 100–106 (2021).
-
Pachitariu, M. & Stringer, C. Cellpose 2.0: how to train your own model. Nat. Methods 19, 1634–1641 (2022).
-
Chen, B.-C. et al. Lattice light-sheet microscopy: imaging molecules to embryos at high spatiotemporal resolution. Science 346, 1257998 (2014).
-
Liu, G. et al. Characterization, comparison, and optimization of lattice light sheets. Sci. Adv. 9, eade6623 (2023).
-
Sezgin, E. et al. Measuring nanoscale diffusion dynamics in cellular membranes with super-resolution STED–FCS. Nat. Protoc. 14, 1054–1083 (2019).
-
R Core Team. R: A Language and Environment for Statistical Computing (R Foundation for Statistical Computing, 2019).
-
Wickham, H. & Bryan, J. readxl: Read Excel Files. R package version 1.4.5, https://readxl.tidyverse.org (2025).
-
Wickham, H. et al. Welcome to the tidyverse. J. Open Source Softw 4, 1686 (2019).
-
Wang, Z. & Hakozaki, H. LiveLattice: real-time visualization of tilted light-sheet microscopy data using a memory-efficient transformation algorithm. Zenodo https://doi.org/10.5281/zenodo.12738245 (2024).
-
Wang, Z. 3D_spheroid_cell_segmentation. Zenodo https://doi.org/10.5281/zenodo.14994434 (2025).
Acknowledgements
We thank L. Lavis and J. Grimm (Janelia Research Campus) for providing JF fluorophores. We thank Irving Garcia (USC) for assistance with cell culture. We thank C. Alvarez (UCSD) for assistance with cloning. We thank J. Bogomolovas and J. Chen (UCSD) for access and assistance to their fluorescence polarization plate reader. We thank J. Chung and J. Yang (UCSD) for access and assistance to their fluorescence and absorbance spectrometer. We thank Z. Liang (UCSD) for help with processing of sequencing results. We thank H. Farrants (Janelia Research Campus) for discussions on chemigenetic biosensors. We thank A. Linnemann (Indiana University) for providing the pAAV-Ins-GCaMP plasmid map. We thank Q. Su (UCSD) for providing the ExRai-CKAR2 plasmid. We thank Y. Kwon (UCSD) for cloning β1AR. We thank N. Bergkamp (UCSD) for critical reading of the manuscript. We thank Q. Ni (UCSD) for support in material acquisition and tissue culture. We thank P. Guo from the UC San Diego Nikon Imaging Center, as well as J. Santini and M. Erb from the UC San Diego School of Medicine Microscopy Core, for assistance with microscopy. We thank the Translational Imaging Center, A. Shwartz and J. Junge, at USC for their help with STED microscopy. This publication includes data generated at the UC San Diego IGM Genomics Center utilizing an Illumina NovaSeq 6000 that was purchased with funding from a National Institutes of Health SIG grant (no. S10 OD026929). The Leica SP8 in the UC San Diego School of Medicine Microscopy Core was funded by NINDS P30NS04710. This research was further supported by the Swiss National Science Foundation (SNSF) grants P2ELP3_199834 and P500PN_214234 to M.S.F.; the Charles Lee Powell Foundation Powell Fellowship at the University of California, San Diego (UCSD) and the UCSD Interfaces Graduate Training Program National Institutes of Health (NIH)/National Institute of Biomedical Imaging and Bioengineering (NIBIB) T32 Training in Multi-scale Analysis of Biological Structures and Function Training Grant 5T32EB009380-15 to S.A.S.; an NIH-K01EB035649 grant to L.L.; an EMBO (ALTF 849-2020) and HFSP (LT000404/2021-L) fellowship to F.S.; an American Heart Association Predoctoral Fellowship (24PRE1196243) to Z.W.; the National Science Foundation (NSF) Graduate Research Fellowship (DGE-2038238) and American Heart Association Predoctoral Fellowship (24PRE1186687) to A.C.L. Any opinions, findings and conclusions or recommendations expressed in this material are those of the author(s) and do not necessarily reflect the views of the NSF; the Swiss National Science Foundation (P2BSP3_200177) and the Larry L. Hillblom Foundation (2023-D-012-FEL) to T.V.R.; the US National Institute of Diabetes and Digestive and Kidney Diseases (P30DK063491 and R01DK101395) and a grant from Janssen Pharmaceuticals to J.M.O.; NIH R01GM149976, NIH U01AI167892, NIH 5R01NS111039, NIH R21NS125395, NIHU54DK134301, NIHU54 HL165443 and UCSD Startup funds to L.S.; NIH Grants DP2 GM150022 and R01 GM148765 to J.S.; NIH grant R01 CA262815 to J.Z. and Y.W.; NIH grants EB029122, R35 GM140929, R01 HL121365 and HD107206 to Y.W.; and NIH grants R35 CA197622, R01 DK073368, R01 DE030497, R01 HL162302 and RF1 MH126707 to J.Z.
Ethics declarations
Competing interests
The authors declare no competing interests.
Peer review
Peer review information
Nature Biotechnology thanks the anonymous reviewers for their contribution to the peer review of this work.
Additional information
Publisher’s note Springer Nature remains neutral with regard to jurisdictional claims in published maps and institutional affiliations.
Extended data
Extended Data Fig. 1 Brightness measurements.
a,b, Basal (a) and activated brightness (b) of HaloAKAR-JF635 biosensors. In b, the brightness of HaloTag7-JF635 is given for comparison. Individual data points are shown from three independent repeats along with mean and 95% confidence intervals. Numbers of cells (n) can be found in Supplementary Table 6. Note that experiment a and b were measured using different microscopy settings given in the methods section.
Extended Data Fig. 2 Subcellularly targeted HaloAKAR biosensors.
a,b, Plasma membrane targeting via fusion to the CAAX sequence of KRAS (a) or Lyn11 (b). c, Outer mitochondrial membrane targeting by fusing to Tomm20. d, Actin targeting via fusion with β-actin. e, Microtubule targeting via microtubule binding protein CEP41. f, Clathrin targeting via fusion with clathrin light chain. Average time courses of HeLa cells expressing targeted HaloAKAR2.0, HaloAKAR2.1, or HaloAKAR2.2 labeled with JF635-CA and stimulated with 50 μM Fsk and 100 μM IBMX (Fsk/IBMX) are shown along with representative images after stimulation. Time courses and images are representative of three replicates. Thick and thin solid lines indicate mean and single-cell responses, respectively; shaded areas correspond to standard deviation (a: n = 8, 8, 7 cells; b: n = 7, 6, 4 cells; c: n = 7, 7, 5 cells; d: n = 5, 7, 4 cells; e: n = 6, 4, 5 cells; f: n = 5, 8, 6 cells). Scale bars, 20 µm.
Extended Data Fig. 3 Characterization of the HaloAKAR series in HEK293T cells in 2D and 3D culture.
a, Characterization of HEK293T cells stably expressing cytosolic HaloAKAR2.1 (HaloAKAR2.1-NES) and plasma membrane EGFP (EGFP-CAAX) labeled with JF635-CA in 2D culture. A representative image overlay (EGFP: green, HaloAKAR: magenta) after Fsk/IBMX stimulation is given. b,c, HEK293T cells expressing cytosolic HaloAKAR2.0-NES, HaloAKAR2.1-NES, or HaloAKAR2.2-NES and plasma membrane EGFP (EGFP-CAAX) labeled with JF635-CA in 2D culture. The dynamic range (ΔF/F0) after Fsk/IBMX stimulation (b, n = 70, 75, 88 cells from three replicates) and time courses after stimulation with Fsk/IBMX (c, n = 29, 25, 29 cells). The dynamic range in HEK293T cells are ΔF/F0 = 0.85 ± 0.04, 6.46 ± 0.24, and 11.21 ± 0.92. d, Time course-measurements of HEK293T cells stably expressing HaloAKAR2.1-NES and EGFP-CAAX labeled with JF635-CA in 2D culture stimulated with 1 µM isoproterenol (iso) followed by Fsk/IBMX (n = 28 cells). e-h, Characterization of the same cell line in 3D spheroid culture. 4-d-old spheroids were labeled with JF635-CA and imaged by spinning-disc confocal microscopy, acquiring images of the entire spheroid (e and f) or a single plane (g and h). Representative overlay images of a single plane (e and g) and the corresponding time course quantification (f: n = 27 cells, h: n = 20 cells) is given. Measuring z-stacks over the entire spheroid height led to some bleaching, in contrast to the single-plane measurements (g and h). Time courses and images are representative of three replicates. Thick solid lines indicate mean response; shaded areas and error bars correspond to 95% confidence interval; single-cell traces are shown if n < 10 (c). Scale bars, 20 μm.
Supplementary information
Supplementary Information
Supplementary Figs. 1–23, Tables 1–9, Video 1, methods and references.
Reporting Summary
Supplementary Video 1
PKA activity in isolated mouse islets upon acute glucose stimulation. Video of isolated mouse islets expressing HaloAKAR2.2-T2A-EGFP labeled with JF635-CA responding to actuate stimulation with glucose (25 mM) at 2 min. Intensity increases corresponding to increased PKA activity can be seen at 5 min (3 min after addition). Scale bar, 50 μm.
Supplementary Data 1
Statistical source data.
Source data
Rights and permissions
Springer Nature or its licensor (e.g. a society or other partner) holds exclusive rights to this article under a publishing agreement with the author(s) or other rightsholder(s); author self-archiving of the accepted manuscript version of this article is solely governed by the terms of such publishing agreement and applicable law.
About this article
Cite this article
Frei, M.S., Sanchez, S.A., He, X. et al. Far-red chemigenetic kinase biosensors enable multiplexed and super-resolved imaging of signaling networks.
Nat Biotechnol (2025). https://doi.org/10.1038/s41587-025-02642-8
-
Received:
-
Accepted:
-
Published:
-
DOI: https://doi.org/10.1038/s41587-025-02642-8


