Now Reading: Lipid nanoparticle screening in nonhuman primates with minimal loss of life
-
01
Lipid nanoparticle screening in nonhuman primates with minimal loss of life
Main
Lipid nanoparticles (LNPs) have delivered RNA in clinical trials and Food and Drug Administration (FDA)-approved products1,2,3,4,5. These data justify efforts to improve LNPs for emerging RNA therapies6. However, LNP design is difficult, in part because it is affected by interconnected variables including the ionizable lipid7, poly(ethylene glycol) (PEG)-lipid8,9, cholesterol10,11,12, helper lipid13,14,15,16 and active targeting ligands17,18,19. This often requires the evaluation of many LNPs in cell culture or mice, followed by the evaluation of a much smaller number in rats. Together, these studies are used to select a lead LNP for evaluation in nonhuman primates (NHPs). One challenge with this serial selection is that the predictivity of one model system to another is weak (for example, cell culture to mice20) or understudied (for example, mice to NHPs). As a result, the cumulative predictivity from cell culture to NHPs may be poor.
To enable high-throughput studies in vivo, scientists developed DNA barcoding assays21,22,23,24,25,26, including species-agnostic nanoparticle delivery screening24, which quantify functional delivery (that is, mRNA translated into protein) across species. By injecting the same barcoded LNPs in mice engineered with partial NHP or human livers, scientists found evidence of species-dependent delivery24. However, these results relied on immunocompromised mice, making it difficult to study the systemic physiological response. The mice also had one nonmouse cell type, which made it challenging to understand both on- and off-target delivery.
While evaluating many LNPs in mice is partially enabling, the translational relevance of a preclinical LNP-mRNA drug candidate is largely determined by its safety and efficacy in NHPs. Yet, very few LNPs are tested in NHPs for two reasons. The first is practical. During the coronavirus disease pandemic, the number of NHPs available for import into the USA decreased, leading to increased animal costs27. These high costs are coupled with long wait times. The second reason is ethical. Quantifying delivery in multiple on- and off-target tissues, which the FDA recently requested ahead of a clinical trial28, requires a terminal experiment. Thus, a hypothetical study evaluating 45 LNPs using 3 animals per group could take several years, cost a large amount of money and lead to the death of 135 animals, excluding control groups.
We hypothesized that we could reduce NHP use by testing many LNPs at once with DNA barcodes (Fig. 1a). To further reduce animal use, we chose NHPs selected by independent veterinarians for humane euthanasia due to preexisting disease. For example, if an animal was selected for euthanasia on a Tuesday, we administered LNPs on Monday. Using these end-of-life (EoL) NHPs conferred two advantages. First, because they were already scheduled for euthanasia, we would minimize the loss of life. Second, like humans, NHPs suffer from spontaneous heart disease, cancer, diabetes and inflammation; we reasoned that EoL studies could help scientists to understand how disease state affects delivery. However, this approach came with two substantial challenges. First, we did not control when the experiment happened, and second, only one animal was available at a time. As a result, it required barcoded LNPs that could be made sterile at a large scale, prealiquoted, frozen and administered over several weeks. Here, we report such a workflow and the subsequent results of 45 barcoded LNPs administered to EoL NHPs with gastrointestinal inflammation, control NHPs without gastrointestinal inflammation, and mice.

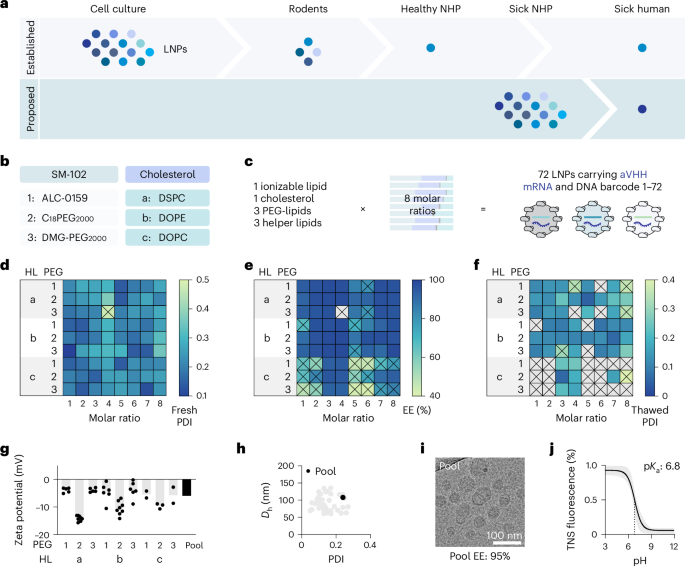
a, LNPs are often selected serially in cell culture, mice, rats and then healthy NHPs. One alternative is testing LNPs in NHPs independently selected for humane euthanasia due to spontaneous disease. b,c, Seventy-two chemically distinct LNPs were created by varying three PEG-lipids, three helper lipids (b) and eight molar ratios (c). d, The PDI of all 72 LNPs; 71 passed this quality control. e, The encapsulation efficiency of these 71 remaining LNPs; 50 passed this quality control. f, The PDI of the 50 remaining LNPs after freeze–thaw; 45 passed this quality control. g, The zeta potential for the 45 individual LNPs (gray) as well as the subsequent pool. h, The hydrodynamic diameter (Dh) and PDI for the 45 individual LNPs as well as the subsequent pool. i, A cryo-TEM image of the pool. j, The TNS fluorescence intensity between pH 3 and pH 12 reveals the pKa of the 45 individual LNPs (gray) as well as the subsequent pool. The vertical dashed line indicates the pKa, which is defined as the point at which 50% of the molecules are charged. ALC-0159, methoxypolyethyleneglycoloxy(2000)-N,N-ditetradecylacetamide; DMG-PEG2000, 1,2-dimyristoyl-rac-glycero-3-methoxypolyethylene glycol-2000; HL, helper lipid; EE, encapsulation efficiency; TNS, 2-(p-toluidino)-naphthalene-6-sulfonic acid.
Results
Barcoded LNPs can be frozen and thawed
We first created sterile barcoded LNPs that could be frozen, aliquoted and then administered when an animal became available. We formulated LNPs so they carried a unique DNA barcode and an mRNA encoding a glycosylphosphatidylinositol-anchored camelid VHH antibody (anchored VHH, aVHH)29; aVHH is a reporter that can be used to quantify LNP delivery24,25,26. LNP-1 with chemical composition 1 was formulated to carry aVHH mRNA as well as DNA barcode 1, whereas LNP-N with chemical composition N was formulated to carry aVHH mRNA as well as DNA barcode N. By using DNA barcodes designed to be sensitive30, we achieved a 10:1 mass ratio of mRNA:barcode. As all three FDA-approved LNP-RNA drugs use nanoparticles with four components and no targeting ligands1,2,3, we designed 72 chemically distinct LNPs with these criteria (Fig. 1b). We used microfluidics to combine the ionizable lipid SM-102 (ref. 31), cholesterol, one of three PEG-lipids, and one of three zwitterionic helper lipids32,33 (Supplementary Fig. 1). To control for the fact that the molar ratio of the components affects delivery14, we formulated the components in eight ways (Fig. 1c and Supplementary Fig. 2). We chose to alter the PEG-lipids34,35, helper lipids36,37 and molar ratios38,39 because they play an important role in LNP potency. Specifically, PEG-lipids help to control particle size during manufacturing and prevent both particle aggregation in the vial and opsonization in the blood. Recent studies suggest that helper lipids are the primary component on the surface of LNPs, indicating that modifying this ingredient could enhance interactions with specific cells. In addition, other studies have shown that LNPs consisting of the same four components but in different molar ratios can exhibit differences in potency. The LNP:nucleic acid mass ratio was 20:1, which is similar to FDA-approved formulations1,2,3.
Because LNPs must be stable after freeze–thaw, we put all 72 through serial quality-control experiments (Supplementary Fig. 3). We first measured the polydispersity index (PDI) after formulation; 71 of the LNPs had a PDI below 0.4 (Fig. 1d). We then measured the encapsulation efficiency of these 71 LNPs; 50 had an encapsulation efficiency above 85% (Fig. 1e). LNPs formulated with 1,2-dioleoyl-sn-glycero-3-phosphocholine (DOPC) tended to have lower encapsulation efficiency than other LNPs. As a third step, we measured the PDI and hydrodynamic diameter of these 50 LNPs after they were mixed with 10% sucrose, frozen and thawed. Forty-five formulations formed monodisperse LNPs with a hydrodynamic diameter between 50 nm and 150 nm and a PDI below 0.3 (Fig. 1f). We combined these 45 LNPs and performed a second series of control experiments, this time on the pool. We thawed the LNP pool, then compared the zeta potential (Fig. 1g), hydrodynamic diameter and PDI (Fig. 1h); the values were within the range of the individual LNPs in the pool. We then imaged the pool using cryo-transmission electron microscopy (cryo-TEM) and found LNPs with distinct morphologies as expected (Fig. 1i). The pool pKa was 6.8, which is similar to the pKa reported for SM-102-based LNPs31 (Fig. 1j). Finally, we measured endotoxin levels and found them to be low enough for NHP use (Supplementary Fig. 4). These data led us to conclude that barcoded LNPs could be frozen and thawed.
Comparing delivery in mice and NHPs
Understanding the extent to which delivery in mice predicts delivery in NHPs could make LNP discovery more efficient. We therefore administered aliquots from the same LNP pool to mice, EoL NHPs with gastrointestinal inflammation and control NHPs. Control NHPs allowed us to evaluate whether EoL NHPs with spontaneous disease had overtly different responses to the LNP pool than NHPs without disease. As a negative control, we included three barcodes that were not formulated in LNPs, because unencapsulated DNA enters cells inefficiently24,25,26. In all three animal models, we intravenously injected the LNPs at a 0.5 mg kg−1 nucleic acid dose (that is, 0.011 mg kg−1 per LNP, on average, for the 45 LNPs; Supplementary Fig. 5). Twenty-four hours later, we isolated liver, spleen, bone marrow and blood, then digested them into single cells (Fig. 2a and Supplementary Figs. 6–9). Using fluorescence-activated cell sorting (FACS), we isolated cells in which aVHH mRNA was translated into aVHH protein (aVHH+ cells) and sequenced them to identify the DNA barcodes within them. This revealed the LNP pool transfection efficiency (aVHH+ percentage) and rank order of all 45 LNPs (normalized barcode reads)24,25,26.

a, Control NHPs, EoL NHPs and mice were injected with a pool of thawed 45 LNPs carrying aVHH mRNA and DNA barcodes. Functional delivery was measured in the liver, spleen, bone marrow and blood cells. LNP barcodes in aVHH+ cells were then sequenced to determine the delivery profile of each LNP. b, aVHH expression in 18 cell types in mice and 22 cell types in control and EoL NHPs. EC, endothelial cell; Hep, hepatocyte; IC, immune cell; Mp, macrophage; T, T cell; B, B cell; NK, natural killer cell; DC, dendritic cell; Mo, monocyte. Data are presented as mean ± s.d. (N = 3, biological replicates). **P = 0.0021, ***P = 0.0003, ****P < 0.0001, analyzed by two-way analysis of variance with Tukey’s post-hoc test for multiple comparisons. c, The average normalized delivery of 45 LNPs and 3 unencapsulated barcodes in 4 cell types (liver EC, hepatocyte, liver IC and spleen macrophage). d, Normalized delivery of 45 LNPs in 4 cell types. e–g, Normalized delivery for the top 10 LNPs in mouse liver hepatocytes (CD31−CD45− cells, e), in control NHP hepatocytes (CD31−CD45−ASGPR+ cells, f) and in EoL NHP hepatocytes (CD31−CD45−ASGPR+ cells, g). h–j, Correlation of normalized delivery of 45 LNPs between mouse and control NHP (h), mouse and EoL NHP (i) and control NHP and EoL NHP (j). Pearson’s correlation coefficient (r) was used to determine the correlation. Panel a created with BioRender.com.
We measured the percentage of aVHH+ cells in 18 cell types isolated from mice and 22 cell types from both control and EoL NHPs. Compared with untreated mice, we observed significant delivery in 13 of the 18 cell types in mice injected with the LNP pool (Supplementary Fig. 10). Compared with untreated NHP controls, the same LNP pool led to significant delivery in 22 (control) and 19 (EoL) of the 22 cell types, respectively. In EoL NHPs, the 19 cell types with delivery came from the liver, spleen and bone marrow, and the three cell types without significant delivery were in the blood (Supplementary Fig. 10d). We then compared the percentage of aVHH+ cells in the 18 cell types isolated from both species. We did not observe significantly higher percentages of aVHH+ cells in any mouse cells compared with NHP cells. Instead, we observed significantly higher delivery in NHP cells in 15 of the 18 cell types (Fig. 2b) and nonsignificantly higher delivery in the remaining three cell types.
We complemented these flow cytometry readouts by sequencing all 45 barcodes and quantifying them using normalized delivery40 (Fig. 2c and Supplementary Fig. 11). We analyzed the normalized delivery of all three unencapsulated barcodes and found that these negative controls behaved as expected (Fig. 2c). In mice, only four cell types had enough aVHH+ cells to be sorted: liver endothelial cells, hepatocytes, liver immune cells and splenic macrophages. When we compared the normalized delivery across species in the four cell types, we found that some LNPs did well in mice and NHPs (Fig. 2d). However, we also found false positives (that is, LNPs that performed well in mice but not in NHPs) and false negatives (that is, LNPs that performed well in NHPs but not mice). To evaluate this practically, we considered the fact that top LNPs in mice are selected for NHP studies. We therefore rank ordered the top ten LNPs in mice and evaluated how they performed in NHPs (Fig. 2e). The top five mouse LNPs did not have high normalized delivery in either NHP model (Fig. 2e). As a control, we rank ordered the top ten LNPs in control NHPs and evaluated how they performed in EoL NHPs and found a strong relationship (Fig. 2f); the same was true when we rank ordered the top LNPs in EoL NHPs and evaluated how they performed in control NHPs (Fig. 2g). We also analyzed the relationship between LNP composition and delivery in hepatocytes from mice, control NHPs and EoL NHPs (Supplementary Fig. 12). In mice, C18PEG2000 outperformed ALC-0159. Meanwhile, there was no difference in delivery between the different PEG-lipids in both control and EoL NHPs. Similarly, in mice, 1,2-dioleoyl-sn-glycero-3-phosphoethanolamine (DOPE) outperformed 1,2-distearoyl-sn-glycero-3-phosphocholine (DSPC). However, DSPC showed significantly higher delivery compared with DOPE in both control and EoL NHPs. We did not find any significant relationship between the eight molar ratios and functional delivery. Finally, we calculated the correlation coefficient for all 45 LNPs in the four cell types we sequenced from mice and NHPs and found it was low between the species (Fig. 2h,i). By contrast, we found higher correlations between control NHPs and EoL NHPs in the same four cell types (Fig. 2j) and high correlations between control NHPs and EoL NHPs in the remaining cell types (Supplementary Fig. 13). Given that mice and NHPs were injected with aliquots from the same LNP pool, these data provide one line of evidence that delivery can vary across species.
We hypothesized that the gastrointestinal inflammation would lead to overt, disease-specific physiological responses to LNPs. We therefore measured 47 physiological parameters before LNP treatment and at the time of euthanasia. Among these, 10 were related to blood (Supplementary Fig. 14a), 8 were related to liver (Supplementary Fig. 14b), 4 were related to kidney (Supplementary Fig. 14c), 4 were related to metabolism (Supplementary Fig. 14d) and 21 were serum cytokines (Supplementary Fig. 14e). We compared 26 blood chemistry values with normal range values41,42, and found 25 were within normal ranges in EoL and control LNPs. Alkaline phosphatase was outside of the normal range in EoL NHPs and within the normal range for control NHPs. These differences were present before and after LNP treatment, suggesting that they were not driven by exposure to LNPs. We also observed responses that were probably driven by LNPs. Specifically, both control and EoL NHPs had significantly elevated interleukin-1 receptor agonist and interleukin-10 serum concentrations compared with the pretreated values from the same animals. The control NHPs also had statistically elevated MCP-1 and MIP-1β levels relative to their pretreated baseline. Given that LNPs can lead to cytokine elevations at earlier time points in mice, it is possible that our cytokine data were measured after the acute response had resolved. These data suggest that there may be minor differences in LNP response, but they did not support our hypothesis that EoL NHPs with gastrointestinal inflammation exhibit overt, disease-dependent responses to LNPs.
LNPs transfect many cell types in NHPs
LNPs formulated with a neutral helper lipid and without targeting ligands are thought to preferentially transfect hepatocytes. However, it remains difficult to measure on- and off-target delivery with single-cell resolution across multiple tissues in NHPs. We therefore analyzed delivery using single-cell RNA sequencing (scRNA-seq). Specifically, we used a DNA tagged anti-aVHH antibody to overlay delivery in the scRNA-seq-defined cells; aVHH-antibody reads were generated if aVHH mRNA was translated into protein (Supplementary Fig. 15). We performed this analysis in 499,792 cells isolated from the liver, spleen and bone marrow (Fig. 3). In all six cases (control NHPs and EoL NHPs, measured in three tissues), we then used unbiased uniform manifold approximation and projection (UMAP)43 and the Harmony algorithm44 to cluster the cells. In the liver, this analysis identified 15 cell types in control and EoL NHPs (Fig. 3a and Supplementary Fig. 16). We then quantified delivery in these cell populations (Fig. 3b,c). The highest aVHH expression was in Kupffer cells, cells that phagocytose nanoparticles in mice45. The average aVHH expression in hepatocytes was fifth highest in both EoL and control NHPs; this suggests that LNPs formulated with a neutral helper lipid may not always preferentially transfect hepatocytes in NHPs.

a, UMAP clustering of 15 cell types in the livers, with their aVHH protein expression at single-cell resolution, overlaid on the UMAP (78,581 cells from control NHP and 59,082 cells from EoL NHP). BC, B cells; cB/TC, cycling B or T cells; CD4TC, CD4 T cells; CD8TC, CD8 T cells; TC, T cells; KC, Kupffer cells; pDC, plasmacytoid DCs; mDC, myeloid DCs; Mo, monocytes; Neu, neutrophils; Hep, hepatocytes; EC, endothelial cells; Unc, unclassified. b,c, Normalized aVHH expression levels in each cluster from control (b) and EoL (c) livers. The box represents the interquartile range, with the median marked by a horizontal line. d, UMAP clustering of 18 cell types in the spleens, with their aVHH protein expression at single-cell resolution, overlaid on the UMAP (80,893 cells from control NHP and 108,465 cells from EoL NHP). mBC, mature B cells; PreBC, pre B cells; cBC, cycling B cells; NK, natural killer cells; nCD4TC, naive CD4 T cells; Mp, macrophages; Fib, fibroblasts. e,f, Normalized aVHH expression levels in each cluster from control (e) and EoL (f) spleens. The box represents the interquartile range, with the median marked by a horizontal line. g, UMAP clustering of 20 cell types in the bone marrow, with their aVHH protein expression at single-cell resolution, overlaid on the UMAP (78,991 cells from control NHP and 93,780 cells from EoL NHP). PC, plasma cells; Ery, erythroid cells; Gran, granulocytes. h,i, Normalized aVHH expression levels in each cluster from control (h) and EoL (i) bone marrow. The box represents the interquartile range, with the median marked by a horizontal line.
In the spleen, unbiased clustering revealed 18 cell populations in both control and EoL NHPs (Fig. 3d and Supplementary Fig. 17). Consistent with the liver, we observed delivery in many cell types, and the cell type with the highest amount of aVHH per cell was a macrophage, a type of myeloid cell (Fig. 3e,f). Finally, in the bone marrow, unbiased analysis identified 20 cell types in control and EoL NHPs (Fig. 3g and Supplementary Fig. 18). Once again, the cell types with the highest transfection were myeloid cells (Fig. 3h,i). We also observed aVHH-positive cells in CD34+ clusters in the bone marrow, which include hematopoietic stem and progenitor cells. These data are consistent with data suggesting LNPs can transfect hematopoietic stem and progenitor cells in NHPs26.
A related hypothesis in nanomedicine is that LNPs preferentially transfect hepatocytes by interacting with low-density lipoprotein receptor (LDLR). Because our data suggested that LNPs interact with multiple cell types across multiple tissues, we reasoned that other receptors might influence LNP tropism. To identify these receptors, we first grouped liver cells into those with no aVHH expression (aVHH−), low aVHH expression (aVHH+) and high aVHH expression (aVHH++). We then performed a differential gene expression analysis, identifying genes that were upregulated (log2 fold change >1.0) and significant (adjusted P value <0.05) in aVHH++ cells relative to aVHH− cells (Fig. 4a). In control NHP livers, 111 genes met these criteria. When we analyzed these genes using Gene Ontology (GO), this unbiased approach found several pathways differentially regulated in aVHH++ cells relative to aVHH− cells (Fig. 4b). Consistent with our hypothesis, the most significant pathway was import into cell (GO:0098657, adjusted P value 1.2 × 10⁻⁵), which includes endocytosis and related transport. Other significant pathways included immune system processes (GO:0002376, adjusted P value 1.5 × 10⁻⁵), chemical homeostasis (GO:0048878, adjusted P value 2.0 × 10⁻⁴), defense response (GO:0006952, adjusted P value 1.0 × 10⁻³) and cholesterol storage (GO:0010878, adjusted P value 1.2 × 10⁻³). When we repeated this analysis in EoL NHPs, we found 124 genes that were upregulated and significant in aVHH++ cells relative to aVHH− cells. When these genes were entered into GO, the same five pathways were significant (adjusted P values 6.4 × 10⁻¹¹, 4.7 × 10⁻⁸, 7.4 × 10⁻⁵, 1.8 × 10⁻⁵ and 5.8 × 10⁻⁵, respectively).

a, Cells from control and EoL NHPs were divided into three groups based on their aVHH expression levels: aVHH−, aVHH+ and aVHH++. Then, we analyzed differentially expressed genes (DEGs) and their associated GO terms in aVHH++ cells compared with aVHH− cells. b, Upregulated genes (log2 fold change >1.0, adjusted P value <0.05) in aVHH++ cells compared with aVHH− cells from control NHP liver were analyzed for their associated GO terms. Driver terms in the biological process are shown. padj, adjusted P value. c, All DEGs in control NHP liver, with LDL-related genes (LRP1, LDLRAD3 and MSR1) highlighted. FDR, false discovery rate; FC, fold change. d, UMAP visualization of the LDL receptor genes and aVHH protein expression in control NHP livers. AUCell scores for the LDL-related genes were assigned as the LDL composite scores. e, Correlation of normalized aVHH expression and LDL composite score of 15 clusters in the livers. Pearson’s correlation coefficient (r) was used to determine the correlation. Dashed lines indicate the 95% confidence level. f, All DEGs (adjusted P value <0.05 in aVHH++ cells compared with aVHH− cells) in control NHP spleen with LDL-related genes highlighted. g, UMAP visualization of LDL receptor genes and aVHH protein expression in control NHP spleens. AUCell scores for LDL-related genes were assigned as the LDL composite scores. h, Correlation of normalized aVHH expression and LDL composite score of 18 clusters in the spleens. Pearson’s correlation coefficient (r) was used to determine the correlation. Dashed lines indicate the 95% confidence level. i, All DEGs (adjusted P value <0.05 in aVHH++ cells compared with aVHH− cells) in control NHP bone marrow with LDL-related genes highlighted. j, UMAP visualization of LDL receptor genes and aVHH protein expression in control NHP bone marrow. AUCell scores for LDL-related genes were assigned as the LDL composite scores. k, Correlation of normalized aVHH expression and LDL composite score of 20 clusters in the bone marrow. Pearson’s correlation coefficient (r) was used to determine the correlation. Dashed lines indicate the 95% confidence level. ID, identify; Min, minimum; Max, maximum.
Among the significantly upregulated genes were three lipoprotein receptor-encoding genes that can interact with LDL: low-density lipoprotein receptor-related protein 1 (LRP1)46, low-density lipoprotein receptor class A domain-containing 3 (LDLRAD3)47 and scavenger receptor type A1 (MSR1)48 (Fig. 4c). To evaluate whether these genes might be associated with higher LNP delivery, we plotted the expression of each gene as well as aVHH protein levels in the NHP livers (Fig. 4d). We also plotted an enrichment score for these genes, which we named the LDL composite. In both EoL and control NHPs, aVHH expression showed a positive correlation with a high LDL composite score (Fig. 4e and Supplementary Fig. 19). Nonhepatocyte cell types fell within the 95% confidence level in the correlation.
We then used the same approach in the spleen. Specifically, we performed differential gene expression analysis on aVHH− and aVHH++ cells, identified significantly upregulated genes (log2 fold change >1.5, adjusted P value <0.05) and analyzed significant pathways using GO. Consistent with the liver, this unbiased analysis suggested that import into cell was significant in both control and EoL splenic cells (adjusted P values 4.0 × 10⁻²⁴ and 2.5 × 10⁻¹², respectively; Supplementary Fig. 20). Once again, genes encoding LRP1, LDLRAD3 and MSR1 were differentially expressed in the aVHH++ cells relative to aVHH− cells (Fig. 4f). When we scored their enrichment alongside aVHH in splenic single cells, we again found that cells with a high LDL composite score had high aVHH expression, even when they did not highly express LDLR (Fig. 4g,h). The same analyses in the bone marrow showed that transport (GO:0006810, the parental term for import into cell) or import into cell was significant in control and EoL NHPs (adjusted P values 4.7 × 10⁻⁴ and 1.0 × 10⁻³, respectively; Supplementary Fig. 21). Similar to the liver and spleen, the LDL receptor genes were significantly upregulated (Fig. 4i), and functional delivery had a positive correlation with LDL composite score (Fig. 4j,k). Taken together, the differential gene expression, GO analyses, overlay data and correlations across the three tissues provide interesting but early evidence that these genes may affect LNP delivery.
Discussion and conclusion
NHPs are a clinically relevant preclinical model for humans, yet it remains difficult to understand how LNP chemistries behave in them. We reasoned that testing many LNPs in EoL NHPs could generate interesting data while minimizing animal use. When mice, control NHPs or EoL NHPs were given aliquots from the same pool of LNPs, we observed higher percentages of aVHH+ cells in NHPs. These data are inconsistent with an established consensus in nanomedicine: that LNP delivery in NHPs is harder than LNP delivery in mice. Until we observed these data, we agreed with that consensus, because many LNPs that excel in mice subsequently fail in NHPs. However, if a group of athletes was drafted for their ability to play basketball and then forced to play football, many would fail, and we might conclude that football is harder than basketball. Our data suggest an alternative hypothesis: LNP delivery in NHPs is different than LNP delivery in mice. It will be important for other laboratories to test this hypothesis using other chemistries.
We did not find overt differences in how EoL and control NHPs responded to LNPs. However, other EoL phenotypes may be different. We anticipate that evaluating delivery in EoL animals with different diseases could identify physiological states that affect delivery in patients. In both NHP models, we observed delivery in many cell types across three tissues. We found this interesting for three reasons. First, some NHP datasets estimate Cas9-mediated gene editing using whole liver tissue, assuming that editing occurs exclusively in hepatocytes. Our data suggest that assumption should be reevaluated. Second, delivery across many cell types and tissues suggests that multiple receptors mediate LNP delivery in vivo. Consistent with this, we found early evidence that other lipoprotein-related receptors may affect LNP delivery. Among them, LDLRAD3, LRP1 and MSR1 were upregulated and significant in aVHH++ cells relative to aVHH− cells. However, we also found non-LDL trafficking-related genes that were upregulated and significant (Supplementary Fig. 22 and Supplementary Table 1). Future studies will be required to understand which genes and pathways truly affect LNP delivery in NHPs, because they could inform clinical trials designed to treat patients with genetically defined dyslipidemias. For example, Verve Therapeutics conjugated GalNAc ligands to LNPs49, because patients with homozygous familial hypercholesterolemia often have loss of function in LDLR50. If non-LDLR receptors enhance LNP delivery, then this approach could be applied to other patient populations. Third, we noted that the LNPs transfected two cell types that may be useful for future mRNA-based therapies. Macrophages and monocytes made to express chimeric antigen receptors have driven cancer immunotherapy51, whereas hematopoietic stem cells edited so they reactivate fetal hemoglobin synthesis may be useful in addressing severe sickle cell disease52. Here, we focused on the average relationship between delivery in mice and delivery in NHPs; this was best addressed using many LNPs at once. However, future EoL NHP studies will probably focus on identifying a lead LNP for detailed preclinical evaluation. Such studies should be used to examine how individual lead LNP formulations compare across multiple species.
It is important to acknowledge the limitations of this Article. The first is that we tested only 45 LNPs. We anticipate experiments that evaluate other chemical spaces. For example, an LNP with a distinct chemical composition exhibited different tropism in mouse bone marrow26. However, chemistries that do not freeze and thaw well will not be amenable to EoL studies. Relatedly, to control for the possibility of LNP mixing, it is important to discard LNPs that are not biophysically stable and include unencapsulated barcodes as negative controls. If an individual LNP shows poor biophysical traits, adding it to the pool will increase the risk of barcode exchange or pool destabilization. A second limitation is that species-to-species relationships could change with the target tissue. Optimizing NHP tissue digestion is challenging; over time, we hope to reliably isolate single cells from other organs. A third caveat is that we focused on linear mRNA. Changing the payload to an antisense oligonucleotide, siRNA, circular RNA, plasmid DNA or noncircular DNA could alter LNP biophysical traits, tropism and cell response. Another caveat of this work is the reliance on the reporter protein aVHH, which is likely to result in more positive delivery readouts than gene editing53,54. We estimate that a similar study using a gene editing payload would result in editing rates approximately threefold lower than the percentage of aVHH+ cells. We also cannot exclude the possibility that the on- and off-target transfection profile could change with the payload. A final issue with the data is that they assume that NHPs are a good model for human delivery. Current systemic RNA datasets suggest that NHPs can model humans1,4,55,56, but it is possible that NHPs will not always recapitulate delivery in patients.
Importantly, these data do not support that scientists skip mouse studies and go straight to NHPs, for several reasons. First, although we found that these LNPs transfected NHP cells better than mouse cells, we anticipate that some chemistries will equally transfect both species, while others will transfect mice better than NHPs. Thus, additional studies comparing distinct chemical spaces in mice and NHPs would be valuable to the field. Second, mice often tolerate nanoparticle-based drugs at higher doses than NHPs. As a result, ensuring that LNP-mRNA drugs are tolerated in mice will reduce preventable toxic outcomes in NHPs. Finally, the use of EoL NHPs requires nanoparticles that are stable after freeze–thaw. Effective nanoparticles, especially in new chemical spaces, may not initially be stable after freeze–thaw but can be optimized for it. By going straight into EoL NHPs, these particles would be prematurely discarded. We believe instead that the data suggest that the most potent LNPs in mice may not be the most potent in NHPs, and structure–activity relationships derived from mouse studies can inform, but should not explicitly drive, LNP design for NHPs. Most importantly, these data suggest that studies in EoL NHPs can generate informative findings while reducing animal use.
Methods
mRNA synthesis
The template for in vitro transcription (IVT) of glycosylphosphatidylinositol-aVHH was purchased from Integrated DNA Technologies. The sequences (Supplementary Table 1) were codon-optimized for mouse (primary species) and human (secondary species) using the GenSmart Codon Optimization tool (GenScript). The linear IVT templates were amplified by PCR using forward and T120 extended reverse primers, then purified with the DNA Clean & Concentrator Kit (Zymo Research). The MEGAscript T7 Transcription Kit (Invitrogen) was used for IVT for 2 h at 37 °C. During the reaction, mRNA was capped with Cap 1 (BOC Sciences) and all UTPs were modified with N1-methylpseudouridine-5′-triphosphate (N1-MeΨTP, BOC Sciences). After 2 h, DNase I was treated to remove the template DNA for 15 min at 37 °C. The resulting mRNA was purified by lithium chloride precipitation. Purified RNA products were analyzed by gel electrophoresis to ensure purity.
Nanoparticle formulation
LNPs were formulated with aVHH mRNA23,24,25. The lipid components were diluted in 100% ethanol. Seventy-two different compositions are listed in Supplementary Fig. 2. DNA barcodes (Integrated DNA Technologies; sequences listed in Supplementary Table 1) were mixed in the nucleic acid phase at a 1:10 ratio of DNA barcodes to mRNA in 25 mM sodium acetate buffer. The phases were then microfluidically mixed32,33 using Ignite (Precision Nanosystems) at a flow rate of 3:1 (nucleic acid:lipid phases) at a total flow rate of 12 ml min−1. LNPs were diluted 1:42 in sterile 10 mM Tris buffer and dialyzed by centrifugation in 100-kDa ultracentrifuge tubes (Amicon) at 4 °C. Then the LNPs were sterile-filtered with a 0.22-µm filter before administration or downstream analysis.
LNP characterization
Hydrodynamic diameters and PDIs of LNPs were measured using high-throughput dynamic light scattering (DynaPro Plate Reader II, Wyatt). DYNAMICS software (version 8.3.1.1145, Wyatt) was used for data collection. Endotoxin levels were measured with the Pierce Chromogenic Endotoxin Quant Kit (Thermo Scientific) before administration (Supplementary Fig. 4). The standard range of 0.01–0.1 endotoxin units (EU) ml−1 was used following the manufacturer’s protocol. Encapsulated mRNA and encapsulation efficiency were evaluated using Quant-iT RiboGreen RNA assay kit (Thermo Fisher Scientific). In brief, an equal volume of 6 ng μl−1 LNP and 1× Tris–EDTA (TE; Thermo Fisher) or 2% Triton X-100 (Sigma-Aldrich) in 1× TE were mixed. After incubation at 37 °C for 10 min, an equal volume of 1:100 of RiboGreen reagent (Thermo Fisher) was added to each well. The fluorescence was quantified using a plate reader (PerkinElmer Victor X4 Microplate Reader) at an excitation wavelength of 485 nm and an emission wavelength of 528 nm. PerkinElmer 2030 Workstation software 4.0 (version 4.00.0.15) was used for data collection. The zeta potential was measured using a Malvern Zetasizer Nano Z. Zetasizer software (version 8.02) was used for data collection. The measurement was done with the refractive index of 1.4, dispersant viscosity of 0.882 cP and refractive index of 1.33.
Freeze–thawing of LNPs
Sucrose (National Formulary, European Pharmacopoeia, Japanese Pharmacopoeia, Chinese Pharmacopoeia, high purity, low endotoxin; Fisher Scientific) was dissolved in a sterile 10 mM Tris buffer at 60% (w/v). LNPs in 10 mM Tris buffer were mixed with 60% (w/v) sucrose solution at 5:1 (v/v LNP:sucrose) for a final concentration of sucrose at 10% (w/v). LNPs were then flash-frozen in liquid nitrogen. Hydrodynamic diameter, PDI and encapsulation efficiency were measured before and after freeze–thawing. Frozen LNPs were stored at ≤−120 °C in the vapor phase of liquid nitrogen. For thawing, LNPs were incubated at room temperature for 20 min.
LNP selection for pooling
After formulation, LNPs with PDI under 0.4 were selected (71 out of 72 LNPs). Then, LNPs with encapsulation efficiency above 85% were selected (50 out of 71 LNPs). As a third step, we measured the PDI and hydrodynamic diameter of these 50 LNPs after they were mixed with 10% sucrose, frozen and thawed. Forty-five formulations remained monodisperse with a hydrodynamic diameter between 50 nm and 150 nm and a PDI below 0.3. The frozen aliquots of selected 45 LNPs were thawed and pooled to assess the physical characteristics. Hydrodynamic diameter, PDI, zeta potential, encapsulation efficiency, encapsulated mRNA, endotoxin level and pKa were measured for the LNP pool. The LNP pool was also imaged by cryo-TEM. Before each administration, 1-ml aliquots of those 45 frozen LNPs were thawed at room temperature and pooled. Each time, the hydrodynamic diameter, PDI, zeta potential, encapsulation efficiency, encapsulated mRNA and endotoxin level were measured.
Cryo-TEM
LNP samples were placed on 300-mesh copper grids, with a holey carbon substrate (1.2-µm holes spaced by 1.3 µm; C-flat, Electron Microscopy Sciences). Grids were glow-discharged (negative charge) for 15 s using a GloQube Plus glow discharge system (Quorum Tech). Samples (3 µl) were blotted with filter paper for 1 s at room temperature and 100% humidity and plunge-frozen into liquid ethane using a Vitrobot Mark IV (Thermo Scientific). Cryo-EM grids were stored in liquid nitrogen until cryo-TEM data acquisition. Cryo-EM grids were loaded under liquid nitrogen temperatures, using a Gatan 914 cryo-TEM sample holder, into a JEOL JEM-2200FS TEM (JEOL) operating at 200 keV. Micrographs were acquired under low-dose conditions using the Serial EM software (v4.1.6)57 with a DE20 direct electron detector device (Direct Electron), at nominal magnifications of ×40,000 or ×80,000, yielding pixel sizes of 1.4 Å and 0.8 Å per pixel, respectively.
pK
a assay
A stock solution of 10 mM HEPES (Sigma-Aldrich), 10 mM 2-(N-morpholino)ethanesulfonic acid (Sigma-Aldrich), 10 mM sodium acetate (Sigma-Aldrich) and 140 mM sodium chloride (Sigma-Aldrich) was prepared and pH adjusted with hydrogen chloride and sodium hydroxide (pH 3–10). Using four replicates for each pH, 140 μl pH-adjusted buffer was added to a 96-well plate, followed by adding 5 μl of 2-(p-toluidino)-naphthalene-6-sulfonic acid (60 μg ml−1). LNPs (5 µl) were added to each well. After 5 min of incubation at 300 rpm, fluorescence (excitation 325 nm, emission 435 nm) was measured using a plate reader.
Mouse experiments
All mouse experiments were performed in accordance with the approval of the Emory University School of Medicine’s Institutional Animal Care and Use Committee. All animals were housed in the Emory University animal facilities. C57BL/6J mice were purchased from The Jackson Laboratory. All mice were housed in the Emory University animal facilities in conventional cages with a 12:12 h light–dark cycle and ad libitum access to food and water. The vivarium was kept at 23 °C with 50% humidity. Mice (N = 3) were injected intravenously with LNP pool (0.5 mg kg−1) in the lateral tail vein.
Mouse cell isolation and staining
Mice were euthanized by CO2 asphyxiation, followed by cervical dislocation and perfusion with 5 ml of 1× phosphate-buffered saline (PBS) through the right atrium. Liver tissues were finely minced and then placed in a digestive enzyme solution including collagenase type I (Sigma-Aldrich), collagenase XI (Sigma-Aldrich) and hyaluronidase (Sigma-Aldrich). The mixture was then incubated at 37 °C, 550 rpm for 45 min (refs. 58,59). For bone marrow, both ends of the femur were cut and 5 ml of RPMI1640 (Sigma-Aldrich) per femur was flushed using a 25-gauge needle. Spleens were finely minced and placed in RPMI1640. Cell suspensions were filtered through a 70-µm mesh. Blood was collected from terminal cardiac puncture, then red blood cells were lysed by ACK lysing buffer (Quality Biological) following the manufacturer’s protocol. Cells were stained to identify specific cell populations and sorted using the Cytek Aurora cell sorter. SpectroFlo software (version 1.3.1, Cytek) was used for data collection. The anti-mouse antibody clones and dilutions used were the following: anti-mouse erythroid cells (TER119, BioLegend, 1:500), anti-CD31 (390, BD, 1:500), anti-CD45.2 (104, BioLegend, 1:500), anti-CD19 (6D5, BioLegend, 1:500), anti-CD3 (17A2, BioLegend, 1:500), anti-CD11c (N418, BioLegend, 1:500) and anti-CD11b (M1/70, BioLegend, 1:500). LIVE/DEAD Fixable Blue Dead Cell Stain Kit (Invitrogen) was used for live cell gating (dilution 1:5000). Flow cytometry staining panels and gating strategies are shown in Supplementary Figs. 6 and 7. Mice injected with 10 mM Tris buffer were used as gating controls.
Rhesus monkey studies
All animal procedures conformed to the requirements of the Animal Welfare Act, and protocols were approved before implementation by Emory University School of Medicine’s Institutional Animal Care and Use Committee. The LNPs were thawed, screened (for example, sterility and endotoxin) and then aliquoted for intravenous injection under aseptic conditions in rhesus monkeys (N = 6; 1–17 years of age, 2.3–6 kg; 3 males and 3 females) comparing the two clinical statuses (healthy versus gastrointestinal inflammation); one uninjected control animal (11 years, 7.2 kg, female) and one uninjected EoL animal (17 years, 9 kg, male) were included. Animals were sedated with telazol (5–8 mg kg−1 intramuscularly), a blood sample was collected at time point 0 and a slow intravenous injection of LNPs was performed using the aseptic technique. Animals were pretreated with diphenhydramine, and no adverse reactions were observed. Complete blood counts and clinical chemistry panels were evaluated before and after administration and found to be within normal limits. Animals were sedated 24 h after administration and weighed, their final blood samples were collected (serum and peripheral blood mononuclear cells) and then the animals were euthanized (overdose of pentobarbital). Tissues were collected and weighed including the liver, spleen and bone marrow from all long bones.
Rhesus cell isolation and staining
Liver tissues were cut into 0.5-cm cubes, placed into a digestive enzyme solution containing 12 ml of R5 medium (RPMI1640 supplemented with 5% fetal bovine serum) supplemented with 150 µg ml−1 of collagenase type I (Sigma-Aldrich), and processed using a GentleMACS Octo Dissociator with heaters (Miltenyi Biotec). The samples were processed using the following protocol: incubation at 37 °C, two sets of clockwise–counterclockwise agitations at 300 rpm for 20 s, two sets of clockwise–counterclockwise agitations at 50 rpm for 40 min and two sets of clockwise–counterclockwise agitations at 300 rpm for 20 s. Spleen tissues were cut into 0.5-cm cubes, placed into 5 ml of R5 medium and processed using a GentleMACS Octo Dissociator with heaters (Miltenyi Biotec) using the m_spleen_1 program. Liver and spleen tissues were taken off the GentleMACS, and bone marrow samples were resuspended in 10 ml of R5 medium. All samples were passed through a 70-µm mesh prewet with 1 ml of R5 medium. After centrifugation at 500g for 10 min, all samples were incubated with ACK lysis buffer for 5 min. Single-cell suspensions were then washed twice with PBS. Forty million cells were incubated with Fc receptor binding inhibitor polyclonal antibody (Invitrogen) for 20 min at 4 °C. Cells were stained to identify specific cell populations and sorted using the Cytek Aurora cell sorter. SpectroFlo software (version 1.3.1, Cytek) was used for data collection. The antibody clones and dilutions used were the following: anti-human CD31 (WM59, BD, 1:50), anti-human ASGPR (REA608, Miltenyi, 1:50), anti-NHP CD45 (D058-1283, BD, 1:50), anti-NHP CD3 (10D12, Miltenyi, 1:50), anti-NHP CD20 (2H7, BioLegend, 1:50), anti-NHP HLA-DR (G46-6/L243, BD, 1:50), anti-NHP CD16 (3G8, BD, 1:50) and anti-NHP CD14 (M5E2, BD, 1:50). The LIVE/DEAD Fixable Blue Dead Cell Stain Kit (Invitrogen) was used for live cell gating (dilution 1:5,000). Anti-camelid VHH antibody (clone 96A3F5, GenScript) was used for detecting aVHH expression. Flow cytometry staining panels and gating strategies are shown in Supplementary Figs. 8 and 9. All remaining cells were aliquoted into 10 million cells and cryopreserved in CryoStor CS10 (StemCell Technologies). In all cases, cryopreserved samples from the respective uninjected control animals were used as gating controls.
Rhesus cytokine analysis
Rhesus monkey sera were sent to IDEXX BioAnalytics and tested on the Milliplex MAP Non-Human Primate Cytokine Magnetic Bead Panel (Millipore, cat. no. PCYTMG-40K-PX23) according to the manufacturer’s protocol. Data were collected by xPONENT 4.3 (Luminex), and data analysis was completed using BELYSA 1.1.0 software. The data collected by the instrument software are expressed as median fluorescence intensity. Analyte standards, quality controls and sample median fluorescence intensity values were adjusted for background. Calibrator data were fit to either a five-parameter logistic or four-parameter logistic model depending on best fit to produce accurate standard curves for each analyte. Quality control and sample data were interpolated from the standard curves and then adjusted according to dilution factor to provide calculated final concentrations of each analyte present in the sample. Qualified assay ranges are presented in Supplementary Table 1.
Barcode counts
For FACS-sorted aVHH+ cells from mice and NHPs, DNA barcodes were isolated by QuickExtract DNA Extraction Solution (Lucigen) following the manufacturer’s protocol. The samples were then amplified using KAPA HiFi HotStart Ready Mix (Roche), following the manufacturer’s protocol. Next-generation sequencing runs were performed using multiplexed runs on Illumina MiniSeq23,60. In brief, the results were processed using a custom Python-based tool to extract raw barcode counts for each cell type. These raw counts were then normalized using R before further analysis. Counts for each particle were normalized to the barcoded LNP mixture injected into mice.
Single-cell multiomics preparation
The BD Rhapsody Single Cell Analysis System was used for single-cell multiomics. Single-cell suspensions were stained with oligo-tagged anti-camelid VHH antibodies (5′-CCTTGGCACCCGAGAATTCCAAAGTATGCCCTACGABAAAAAAAAAAAAAAAAAAAAAAAAAAAA*A*A-3′ chemically conjugated to MonoRab rabbit anti-camelid VHH antibody, mAb, GenScript; the asterisks denote phosphorothioate bonds). The final concentration was 0.5 mg ml−1 by protein weight. The dilution for staining was 1:2,000. After washing the labeled cells twice with PBS, the cell viability and numbers were recorded for each sample. The cells were then pooled at the same ratio, and a BD Rhapsody cartridge was loaded with 60,000 cells. cDNA libraries were prepared using the BD Rhapsody Whole Transcriptome Analysis Amplification Kit following the BD Rhapsody System mRNA Whole Transcriptome Analysis and Sample Tag Library Preparation protocol (BD Biosciences). The final libraries were quantified using a Qubit fluorometer and sent to Novogene for sequencing. After the assessment of library quality using Bioanalyzer (Agilent), sequencing was performed by Illumina NovaSeq X Plus PE150 at Novogene.
Processing of single-cell multiomics sequencing data
The data were processed using STARsolo (v2.7.9a)61 in R (v4.3.1). All samples were mapped to rheMac10, and only exonic regions were counted. All output files were loaded into Seurat (v5.0.1). Global-scaling normalization was used for the aVHH expression assay in a Seurat object. The process normalizes the feature expression measurements for each cell by the total expression, multiplies this by a scale factor 10,000 and log-transforms the result. DoubletFinder (v3) was used to identify doublets62. This was followed by principal component analysis dimensional reduction and UMAP clustering. aVHH oligo-tag counts were combined with RNA counts in Seurat and treated similarly to other multimodal datasets such as cellular indexing of transcriptomes and epitopes by sequencing (CITE-seq)63. Visualization of gene and aVHH expression levels was performed using R/Seurat commands (FeaturePlot and DotPlot). For the integration of multiple Seurat objects, Harmony algorithm (v.1.2.1) was used. For UMAP representation in Fig. 3a,d,g, cell clusters were manually annotated in Seurat with marker genes listed in Supplementary Figs. 16–18.
Statistics and reproducibility
A minimum of three biological replicates were analyzed for quantification, except for untreated rhesus monkeys (N = 1). For the representative cryo-TEM image (Fig. 1i), four wide-field images and at least ten high-magnification images (×40,000) were collected from one batch of LNP pool with a representative size distribution. All data are presented as the mean ± standard deviation or standard error of mean. Statistical analysis between groups was performed using GraphPad Prism (versions 9.5 and 10). For data with multiple groups, the statistically significant differences were assessed using two-way analysis of variance with Tukey’s multiple-comparison test. For comparisons between two groups, unpaired two-tailed Student’s t-tests were used. The sample sizes (biological replicates), specific statistical tests and main effects of our statistical analyses for each experiment are detailed in each figure legend. A P value of less than 0.05 was considered significant.
Reporting summary
Further information on research design is available in the Nature Portfolio Reporting Summary linked to this article.
Data availability
scRNA-seq raw data have been deposited to the NCBI Sequence Read Archive (SRA) database (BioSample identifiers SAMN46376639-SAMN46376662; 24 objects) under project identifier PRJNA1214529 (ref. 64). The mouse genome GRCm39 is available at https://www.ncbi.nlm.nih.gov/datasets/genome/GCF_000001635.27/. The rhesus macaque genome rheMac10 is available at https://www.ncbi.nlm.nih.gov/datasets/genome/GCF_003339765.1/. All other data are shown within the article.
References
-
Adams, D. et al. Patisiran, an RNAi therapeutic, for hereditary transthyretin amyloidosis. N. Engl. J. Med. 379, 11–21 (2018).
-
Polack, F. P. et al. Safety and efficacy of the BNT162b2 mRNA Covid-19 vaccine. N. Engl. J. Med. 383, 2603–2615 (2020).
-
Baden, L. R. et al. Efficacy and safety of the mRNA-1273 SARS-CoV-2 vaccine. N. Engl. J. Med. 384, 403–416 (2020).
-
Gillmore, J. D. et al. CRISPR–Cas9 in vivo gene editing for transthyretin amyloidosis. N. Engl. J. Med. 385, 493–502 (2021).
-
Longhurst, H. J. et al. CRISPR–Cas9 in vivo gene editing of KLKB1 for hereditary angioedema. N. Engl. J. Med. 390, 432–441 (2024).
-
Kim, J., Eygeris, Y., Ryals, R. C., Jozić, A. & Sahay, G. Strategies for non-viral vectors targeting organs beyond the liver. Nat. Nanotechnol. 19, 428–447 (2024).
-
Zhang, Y., Sun, C., Wang, C., Jankovic, K. E. & Dong, Y. Lipids and lipid derivatives for RNA delivery. Chem. Rev. 121, 12181–12277 (2021).
-
Mui, B. L. et al. Influence of polyethylene glycol lipid desorption rates on pharmacokinetics and pharmacodynamics of siRNA lipid nanoparticles. Mol. Ther. Nucleic Acids 2, e139 (2013).
-
Gautam, M. et al. Lipid nanoparticles with PEG-variant surface modifications mediate genome editing in the mouse retina. Nat. Commun. 14, 6468 (2023).
-
Patel, S. et al. Boosting intracellular delivery of lipid nanoparticle-encapsulated mRNA. Nano Lett. 17, 5711–5718 (2017).
-
Paunovska, K. et al. Nanoparticles containing oxidized cholesterol deliver mRNA to the liver microenvironment at clinically relevant doses. Adv. Mater. 31, 1807748 (2019).
-
Patel, S. et al. Naturally-occurring cholesterol analogues in lipid nanoparticles induce polymorphic shape and enhance intracellular delivery of mRNA. Nat. Commun. 11, 983 (2020).
-
Kauffman, K. J. et al. Rapid, single-cell analysis and discovery of vectored mRNA transfection in vivo with a loxP-flanked tdTomato reporter mouse. Mol. Ther. Nucleic Acids 10, 55–63 (2018).
-
Cheng, Q. et al. Selective organ targeting (SORT) nanoparticles for tissue-specific mRNA delivery and CRISPR–Cas gene editing. Nat. Nanotechnol. 15, 313–320 (2020).
-
LoPresti, S. T., Arral, M. L., Chaudhary, N. & Whitehead, K. A. The replacement of helper lipids with charged alternatives in lipid nanoparticles facilities targeted mRNA delivery to the spleen and lungs. J. Control. Release 345, 819–831 (2022).
-
Radmand, A. et al. The transcriptional response to lung-targeting lipid nanoparticles in vivo. Nano Lett. 23, 993–1002 (2023).
-
Veiga, N. et al. Cell specific delivery of modified mRNA expressing therapeutic proteins to leukocytes. Nat. Commun. 9, 4493 (2018).
-
Breda, L. et al. In vivo hematopoietic stem cell modification by mRNA delivery. Science 381, 436–443 (2023).
-
Rurik, J. G. et al. CAR T cells produced in vivo to treat cardiac injury. Science 375, 91–96 (2022).
-
Paunovska, K. et al. A direct comparison of in vitro and in vivo nucleic acid delivery mediated by hundreds of nanoparticles reveals a weak correlation. Nano Lett. 18, 2148–2157 (2018).
-
Yaari, Z. et al. Theranostic barcoded nanoparticles for personalized cancer medicine. Nat. Commun. 7, 13325 (2016).
-
Dahlman, J. E. et al. Barcoded nanoparticles for high throughput in vivo discovery of targeted therapeutics. Proc. Natl Acad. Sci. USA 114, 2060–2065 (2017).
-
Sago, C. D. et al. High-throughput in vivo screen of functional mRNA delivery identifies nanoparticles for endothelial cell gene editing. Proc. Natl Acad. Sci. USA 115, E9944–E9952 (2018).
-
Hatit, M. Z. C. et al. Species-dependent in vivo mRNA delivery and cellular responses to nanoparticles. Nat. Nanotechnol. 17, 310–318 (2022).
-
Dobrowolski, C. et al. Nanoparticle single-cell multiomic readouts reveal that cell heterogeneity influences lipid nanoparticle-mediated messenger RNA delivery. Nat. Nanotechnol. 17, 871–879 (2022).
-
Kim, H. et al. Lipid nanoparticle-mediated mRNA delivery to CD34+ cells in rhesus monkeys. Nat. Biotechnol. https://doi.org/10.1038/s41587-024-02470-2 (2024).
-
National Academies of Sciences, Engineering and Medicine. Nonhuman Primate Models in Biomedical Research: State of the Science and Future Needs (The National Academies Press, 2023); https://doi.org/10.17226/26857
-
United States Securities and Exchange Commission Form 8-K. Verve Therapeutics https://ir.vervetx.com/static-files/ff045a43-e13f-4f30-b651-c9946c0055dd (2022).
-
Tiwari, P. M. et al. Engineered mRNA-expressed antibodies prevent respiratory syncytial virus infection. Nat. Commun. 9, 3999 (2018).
-
Sago, C. D. et al. Modifying a commonly expressed endocytic receptor retargets nanoparticles in vivo. Nano Lett. 18, 7590–7600 (2018).
-
Hassett, K. J. et al. Optimization of lipid nanoparticles for intramuscular administration of mRNA vaccines. Mol. Ther. Nucleic Acids 15, 1–11 (2019).
-
Chen, D. et al. Rapid discovery of potent siRNA-containing lipid nanoparticles enabled by controlled microfluidic formulation. J. Am. Chem. Soc. 134, 6948–6951 (2012).
-
Belliveau, N. M. et al. Microfluidic synthesis of highly potent limit-size lipid nanoparticles for in vivo delivery of siRNA. Mol. Ther. Nucleic Acids 1, e37 (2012).
-
Lam, K. et al. Optimizing lipid nanoparticles for delivery in primates. Adv. Mater. 35, e2211420 (2023).
-
Gao, M. et al. Deciphering the role of PEGylation on the lipid nanoparticle-mediated mRNA delivery to the liver. ACS Nano 19, 5966–5978 (2025).
-
Guo, Z. et al. Helper lipid-enhanced mRNA delivery for treating metabolic dysfunction-associated fatty liver disease. Nano Lett. 24, 6743–6752 (2024).
-
Barbieri, B. D. et al. The role of helper lipids in optimising nanoparticle formulations of self-amplifying RNA. J. Control. Release 374, 280–292 (2024).
-
Zhu, Y. et al. Screening for lipid nanoparticles that modulate the immune activity of helper T cells towards enhanced antitumour activity. Nat. Biomed. Eng. 8, 544–560 (2024).
-
Kauffman, K. J. et al. Optimization of lipid nanoparticle formulations for mRNA delivery in vivo with fractional factorial and definitive screening designs. Nano Lett. 15, 7300–7306 (2015).
-
Lokugamage, M. P., Sago, C. D. & Dahlman, J. E. Testing thousands of nanoparticles in vivo using DNA barcodes. Curr. Opin. Biomed. Eng. 7, 1–8 (2018).
-
Koo, B. S. et al. Reference values of hematological and biochemical parameters in young-adult cynomolgus monkey (Macaca fascicularis) and rhesus monkey (Macaca mulatta) anesthetized with ketamine hydrochloride. Lab. Anim. Res. 35, 7 (2019).
-
Buchl, S. J. & Howard, B. Hematologic and serum biochemical and electrolyte values in clinically normal domestically bred rhesus monkeys (Macaca mulatta) according to age, sex, and gravidity. Lab. Anim. Sci. 47, 528–533 (1997).
-
Becht, E. et al. Dimensionality reduction for visualizing single-cell data using UMAP. Nat. Biotechnol. 37, 38–44 (2018).
-
Korsunsky, I. et al. Fast, sensitive and accurate integration of single-cell data with Harmony. Nat. Methods 16, 1289–1296 (2019).
-
Witzigmann, D. et al. Lipid nanoparticle technology for therapeutic gene regulation in the liver. Adv. Drug Deliv. Rev. 159, 344–363 (2020).
-
Rohlmann, A., Gotthardt, M., Hammer, R. E. & Herz, J. Inducible inactivation of hepatic LRP gene by cre-mediated recombination confirms role of LRP in clearance of chylomicron remnants. J. Clin. Invest. 101, 689–695 (1998).
-
Ranganathan, S. et al. LRAD3, a novel low-density lipoprotein receptor family member that modulates amyloid precursor protein trafficking. J. Neurosci. 31, 10836–10846 (2011).
-
Goldstein, J. L., Ho, Y. K., Basu, S. K. & Brown, M. S. Binding site on macrophages that mediates uptake and degradation of acetylated low density lipoprotein, producing massive cholesterol deposition. Proc. Natl Acad. Sci. USA 76, 333–337 (1979).
-
Kasiewicz, L. N. et al. GalNAc-Lipid nanoparticles enable non-LDLR dependent hepatic delivery of a CRISPR base editing therapy. Nat. Commun. 14, 2776 (2023).
-
Cuchel, M. et al. Homozygous familial hypercholesterolaemia: new insights and guidance for clinicians to improve detection and clinical management. A position paper from the Consensus Panel on Familial Hypercholesterolaemia of the European Atherosclerosis Society. Eur. Heart J. 35, 2146–2157 (2014).
-
Klichinsky, M. et al. Human chimeric antigen receptor macrophages for cancer immunotherapy. Nat. Biotechnol. 38, 947–953 (2020).
-
Frangoul, H. et al. Exagamglogene Autotemcel for severe sickle cell disease. N. Engl. J. Med. 390, 1649–1662 (2024).
-
Sun, Y. et al. In vivo editing of lung stem cells for durable gene correction in mice. Science 384, 1196–1202 (2024).
-
Palanki, R. et al. In utero delivery of targeted ionizable lipid nanoparticles facilitates in vivo gene editing of hematopoietic stem cells. Proc. Natl Acad. Sci. USA 121, e2400783121 (2024).
-
Estes, J. D., Wong, S. W. & Brenchley, J. M. Nonhuman primate models of human viral infections. Nat. Rev. Immunol. 18, 390–404 (2018).
-
Capitanio, J. P. & Emborg, M. E. Contributions of non-human primates to neuroscience research. Lancet 371, 1126–1135 (2008).
-
Mastronarde, D. N. Automated electron microscope tomography using robust prediction of specimen movements. J. Struct. Biol. 152, 36–51 (2005).
-
Dahlman, J. E. et al. In vivo endothelial siRNA delivery using polymeric nanoparticles with low molecular weight. Nat. Nanotechnol. 9, 648–655 (2014).
-
Sager, H. B. et al. RNAi targeting multiple cell adhesion molecules reduces immune cell recruitment and vascular inflammation after myocardial infarction. Sci. Transl. Med. 8, 342ra380 (2016).
-
Ni, H. et al. Piperazine-derived lipid nanoparticles deliver mRNA to immune cells in vivo. Nat. Commun. 13, 4766 (2022).
-
Dobin, A. et al. STAR: ultrafast universal RNA-seq aligner. Bioinformatics 29, 15–21 (2013).
-
McGinnis, C. S., Murrow, L. M. & Gartner, Z. J. DoubletFinder: doublet detection in single-cell RNA sequencing data using artificial nearest neighbors. Cell Syst. 8, 329–337 (2019).
-
Stoeckius, M. et al. Simultaneous epitope and transcriptome measurement in single cells. Nat. Methods 14, 865–868 (2017).
-
Zenhausern, R., Kim, H. & Dahlman, J. E. Lipid nanoparticle screening in nonhuman primates with minimal loss of life. Sequence Read Archive https://www.ncbi.nlm.nih.gov/bioproject/PRJNA1214529 (2025).
Acknowledgements
We thank R. P. Johnson, a director of the Emory National Primate Research Center, for supporting the study. We thank K. Tiegren at Emory University for copyediting the paper. We also thank R. C. Guerrero-Ferreira at the Emory University Robert P. Apkarian Integrated Electron Microscopy Core Facility (RRID: SCR_023537) for cryo-TEM imaging. These studies were supported through the NIH Somatic Cell Genome Editing Consortium (grant no. UH3-TR002855, awarded to J.E.D.) This work was supported in part through ATLANTIS NIH training grant in Kidney, Urology, and Hematology (grant no. TL1DK136047, awarded to R.Z.) and the NIH’s Office of the Director, Office of Research Infrastructure Programs (grant no. P51OD011132, awarded to E.H.C., J.S.W. and R.L.S. at Emory National Primate Research Center). The cryo-TEM data described here were collected on the JEOL JEM-2200FS 200 kV TEM supported by the National Science Foundation Major Research Instrumentation Grant 0923395.
Ethics declarations
Competing interests
J.E.D. advises Readout Capital, Edge Animal Health and Nava Therapeutics. The other authors declare no competing interests.
Peer review
Peer review information
Nature Biotechnology thanks M. Cromer, Yizhou Dong and the other, anonymous, reviewer(s) for their contribution to the peer review of this work.
Additional information
Publisher’s note Springer Nature remains neutral with regard to jurisdictional claims in published maps and institutional affiliations.
Supplementary information
Rights and permissions
Open Access This article is licensed under a Creative Commons Attribution-NonCommercial-NoDerivatives 4.0 International License, which permits any non-commercial use, sharing, distribution and reproduction in any medium or format, as long as you give appropriate credit to the original author(s) and the source, provide a link to the Creative Commons licence, and indicate if you modified the licensed material. You do not have permission under this licence to share adapted material derived from this article or parts of it. The images or other third party material in this article are included in the article’s Creative Commons licence, unless indicated otherwise in a credit line to the material. If material is not included in the article’s Creative Commons licence and your intended use is not permitted by statutory regulation or exceeds the permitted use, you will need to obtain permission directly from the copyright holder. To view a copy of this licence, visit http://creativecommons.org/licenses/by-nc-nd/4.0/.
About this article

Cite this article
Zenhausern, R., Jang, B., Schrader Echeverri, E. et al. Lipid nanoparticle screening in nonhuman primates with minimal loss of life.
Nat Biotechnol (2025). https://doi.org/10.1038/s41587-025-02711-y
-
Received:
-
Accepted:
-
Published:
-
DOI: https://doi.org/10.1038/s41587-025-02711-y


Related Posts


Stay Informed With the Latest & Most Important News
Previous Post
Next Post


Advertisement