Now Reading: Scalable spatial transcriptomics through computational array reconstruction
-
01
Scalable spatial transcriptomics through computational array reconstruction
Data availability
Code availability
References
-
Chen, K. H., Boettiger, A. N., Moffitt, J. R., Wang, S. & Zhuang, X. Spatially resolved, highly multiplexed RNA profiling in single cells. Science 348, aaa6090 (2015).
-
Shah, S., Lubeck, E., Zhou, W. & Cai, L. In situ transcription profiling of single cells reveals spatial organization of cells in the mouse hippocampus. Neuron 92, 342–357 (2016).
-
Ståhl, P. L. et al. Visualization and analysis of gene expression in tissue sections by spatial transcriptomics. Science 353, 78–82 (2016).
-
Wang, X. et al. Three-dimensional intact-tissue sequencing of single-cell transcriptional states. Science 361, eaat5691 (2018).
-
Rodriques, S. G. et al. Slide-seq: a scalable technology for measuring genome-wide expression at high spatial resolution. Science 363, 1463–1467 (2019).
-
Moses, L. & Pachter, L. Museum of spatial transcriptomics. Nat. Methods 19, 534–546 (2022).
-
Liu, Y. et al. High-spatial-resolution multi-omics sequencing via deterministic barcoding in tissue. Cell 183, 1665–1681 (2020).
-
Lieberman-Aiden, E. et al. Comprehensive mapping of long-range interactions reveals folding principles of the human genome. Science 326, 289–293 (2009).
-
Singer, A. A remark on global positioning from local distances. Proc. Natl Acad. Sci. USA 105, 9507–9511 (2008).
-
Novembre, J. et al. Genes mirror geography within Europe. Nature 456, 98–101 (2008).
-
Glaser, J. I., Zamft, B. M., Church, G. M. & Kording, K. P. Puzzle imaging: using large-scale dimensionality reduction algorithms for localization. PLoS One 10, e0131593 (2015).
-
Boulgakov, A. A., Ellington, A. D. & Marcotte, E. M. Bringing microscopy-by-sequencing into view. Trends Biotechnol. 38, 154–162 (2020).
-
Weinstein, J. A., Regev, A. & Zhang, F. DNA microscopy: optics-free spatio-genetic imaging by a stand-alone chemical reaction. Cell 178, 229–241.e16 (2019).
-
Weinstein, J. A. & Qian, N. Volumetric imaging of an intact organism by a distributed molecular network. Preprint at bioRxiv https://doi.org/10.1101/2023.08.11.553025 (2023).
-
Hoffecker, I. T., Yang, Y., Bernardinelli, G., Orponen, P. & Högberg, B. A computational framework for DNA sequencing microscopy. Proc. Natl Acad. Sci. USA 116, 19282–19287 (2019).
-
Greenstreet, L. et al. DNA-GPS: A theoretical framework for optics-free spatial genomics and synthesis of current methods. Cell Syst. 14, 844–859.e4 (2023).
-
McInnes, L., Healy, J. & Melville, J. UMAP: Uniform Manifold Approximation and Projection for dimension reduction. Preprint at arXiv https://doi.org/10.48550/arxiv.1802.03426 (2018).
-
Stickels, R. R. et al. Highly sensitive spatial transcriptomics at near-cellular resolution with Slide-seqV2. Nat. Biotechnol. 39, 313–319 (2021).
-
Cable, D. M. et al. Robust decomposition of cell type mixtures in spatial transcriptomics. Nat. Biotechnol. 40, 517–526 (2022).
-
Russell, A. J. C. et al. Slide-tags enables single-nucleus barcoding for multimodal spatial genomics. Nature 625, 101–109 (2024).
-
Yu, T. et al. Differentially expressed transcripts from phenotypically identified olfactory sensory neurons. J. Comp. Neurol. 483, 251–262 (2005).
-
Cable, D. M. et al. Cell type-specific inference of differential expression in spatial transcriptomics. Nat. Methods 19, 1076–1087 (2022).
-
Becht, E. et al. Dimensionality reduction for visualizing single-cell data using UMAP. Nat. Biotechnol. 37, 38–44 (2019).
-
Kajihara, T. et al. Non-rigid registration of serial section images by blending transforms for 3D reconstruction. Pattern Recognit. 96, 106956 (2019).
-
Lee, B. C., Tward, D. J., Mitra, P. P. & Miller, M. I. On variational solutions for whole brain serial-section histology using a Sobolev prior in the computational anatomy random orbit model. PLoS Comput. Biol. 14, e1006610 (2018).
-
Virtanen, P. et al. SciPy 1.0: fundamental algorithms for scientific computing in Python. Nat. Methods 17, 261–272 (2020).
-
Nolet, C. J. et al. Bringing UMAP closer to the speed of light with GPU acceleration. In Proc. AAAI Conf. Artif. Intell. Vol. 35, 418–426 (AAAI Press, 2021).
-
Palla, G. et al. Squidpy: a scalable framework for spatial omics analysis. Nat. Methods 19, 171–178 (2022).
-
Zheng, G. X. Y. et al. Massively parallel digital transcriptional profiling of single cells. Nat. Commun. 8, 14049 (2017).
-
Fleming, S. J. et al. Unsupervised removal of systematic background noise from droplet-based single-cell experiments using CellBender. Nat. Methods 20, 1323–1335 (2023).
-
Qiu, C. et al. A single-cell time-lapse of mouse prenatal development from gastrula to birth. Nature 626, 1084–1093 (2024).
-
Hu, C. et al. Scalable spatial transcriptomics through computational array reconstruction. Datasets. NCBI SRA. https://www.ncbi.nlm.nih.gov/sra/PRJNA1221542 (2025).
-
Hu, C. et al. Scalable spatial transcriptomics through computational array reconstruction. Source code. Github https://github.com/Chenlei-Hu/Slide_recon (2024).
Acknowledgements
We thank D. Sun, R. Raichur and S. Alakwe for assistance with tissue handling and library preparation; D. Cable for the initial computational implementation of the idea; and K. Cao, J. Zhang, M. Dai, X. Ye and P. Yadollahpour for discussion on the computational algorithm. We thank L. Gaffney for helping with schematics and illustrations. This work was supported by the National Institutes of Health (grant R01HG010647 to F.C. and E.Z.M.) and a subaward from NHGRI TDCC (U24HG011735 to F.C. and E. Z. M.). F.C. also acknowledges support from the Searle Scholars Award, the Burroughs Wellcome Fund CASI award and the Merkin Institute. This research was supported by the New York Stem Cell Foundation. F.C. is a New York Stem Cell Foundation – Robertson Investigator.
Ethics declarations
Competing interests
F.C. is an academic founder of Curio Biosciences and Doppler Biosciences and scientific advisor for Amber Bio. F.C.’s interests were reviewed and managed by the Broad Institute in accordance with their conflict-of-interest policies. C.H., M.B. and F.C. are listed as inventors on a patent application related to the work. E.Z.M. is an academic founder of Curio Biosciences. The remaining authors declare no competing interests.
Peer review
Peer review information
Nature Biotechnology thanks Song Chen and the other, anonymous, reviewer(s) for their contribution to the peer review of this work.
Additional information
Publisher’s note Springer Nature remains neutral with regard to jurisdictional claims in published maps and institutional affiliations.
Extended data
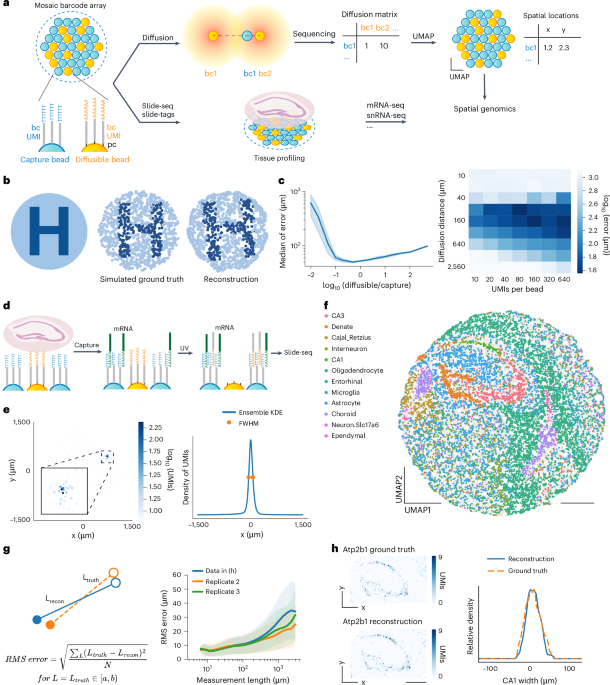
Extended Data Fig. 1 Simulation of diffusion and reconstruction with UMAP.
a, Simulated locations of capture beads and diffusible beads in a 3 mm circle. b, Simulated diffusion pattern of a capture bead on its associated diffusible beads, colored by simulated UMI counts. The distribution plots on the top and right represents the diffusion distribution on the x and y axis respectively. c, Simulated locations of capture beads, colored by a two dimensional color gradient depending on the locations. d, UMAP reconstructed locations of capture beads, colored the same as in c. e, Absolute error of capture beads plotted in ground truth locations. f, Displacement vectors of capture beads. Each arrow starts from the capture bead’s ground truth location and ends at the reconstruction location. g, Histogram plot of capture beads’ absolute error.
Extended Data Fig. 2 Slide-seq reconstruction metrics.
a, Absolute error of capture beads plotted in ground truth locations. b, Displacement vectors of capture beads. Each arrow starts from the capture bead’s ground truth location and ends at the reconstruction location. c, Histogram plot of capture beads’ absolute errors. d, Spatial location of capture beads in ground truth, colored by decomposed cell types. e, Relative RMS error of measurement lengths as a function of measurement length. Data shown in Fig. 1f (blue) and two biological replicates (orange and green) are presented. Solid lines represent average values across beads and shaded areas represent one standard deviation. f, CA1 width measured in ground truth and reconstruction (N = 3 biological replicates). Data shown in Fig. 1f (blue) and two biological replicates (orange and green) are shown. Gray lines showed the mean width of each group. g, Neighborhood enrichment analysis between cell-type pairs in reconstruction (left) and ground truth (right). The enrichment scores are plotted in the same color scale, higher scores represent more enriched in the neighborhoods. h, Barcode matching between Slide-seq library and in situ sequencing barcode list or reconstruction barcode list. Bead barcodes with >20 UMI counts were matched with hamming distance ≤1. Blue rectangle represents total barcodes from in situ sequencing and dark blue represents barcodes matched with Slide-seq library barcodes (shown as green rectangle). Yellow rectangle represents total barcodes from reconstruction and dark yellow represents barcodes matched with Slide-seq library barcodes. i, Violin plot of UMI count per bead with the same Slide-seq library matched to reconstruction results and in situ sequencing results. Scale bars: 500 µm.
Extended Data Fig. 3 Slide-tags Reconstruction metric.
a, Absolute error of capture beads plotted in ground truth locations. b, Displacement vectors of capture beads. Each arrow starts from the capture bead’s ground truth location and ends at the reconstruction location. c, Histogram plot of capture bead locations’ absolute errors. d, Spatial representation of reconstruction error on each nucleus. e, Displacement vectors of located nuclei. Each arrow starts from the nuclei’s ground truth location and ends at the reconstruction location. f, Histogram plot of nuclei locations’ absolute errors. f, RMS error of measurement lengths between bead pairs as a function of measurement length. Solid lines represent average values, and shaded areas represent one standard deviation.
Supplementary information
Rights and permissions
Springer Nature or its licensor (e.g. a society or other partner) holds exclusive rights to this article under a publishing agreement with the author(s) or other rightsholder(s); author self-archiving of the accepted manuscript version of this article is solely governed by the terms of such publishing agreement and applicable law.
About this article

Cite this article
Hu, C., Borji, M., Marrero, G.J. et al. Scalable spatial transcriptomics through computational array reconstruction.
Nat Biotechnol (2025). https://doi.org/10.1038/s41587-025-02612-0
-
Received:
-
Accepted:
-
Published:
-
DOI: https://doi.org/10.1038/s41587-025-02612-0


Related Posts


Stay Informed With the Latest & Most Important News


Advertisement